 --%3E%3Csvg version='1.1' id='Lager_1' xmlns='http://www.w3.org/2000/svg' xmlns:xlink='http://www.w3.org/1999/xlink' x='0px' y='0px' viewBox='0 0 1500 371.7' style='enable-background:new 0 0 1500 371.7%3B' xml:space='preserve'%3E%3Cstyle type='text/css'%3E.st0%7Bfill:%23005EA8%3B%7D%3C/style%3E%3Cg%3E%3Cpath class='st0' d='M237.9 12.6h-89.8v8.9l1.8 0.3c19.6 3 28.5 6.5 32 12.6c1.3 2.2 1.9 4.9 1.9 8.2c0 11.3-7.2 29.4-19 58.8c0 0-28.2 71.2-35.8 90.3c-3.6-9.2-47.8-121.4-47.8-121.4l-1.9-4.7c-3.2-8-6.8-16.7-6.8-24.1c0-3.1 0.6-5.9 2.1-8.4c3.6-6 12.5-9.8 26.3-11.3l1.9-0.2v-9H0v8.9l1.9 0.2c25.4 3 32.5 21.2 41.4 44.2l1 2.6c0 0 70.8 178.5 70.8 178.5h7.2l59.9-150.7l2.8-6.8c17.1-42.2 26.5-65.5 53-67.9l1.9-0.2v-9H237.9z'/%3E%3Cpath class='st0' d='M243.4 87.4l-40.9 14.9v6l1 0.6c18 11 18 14.4 18 27.3v63.2c-0.3 25.2-1 27.6-22.5 31l-1.8 0.3v8.9h76.7v-8.9l-1.8-0.3c-21.6-3.4-22.5-4.5-22.5-31V89.3l-5.5-2.1L243.4 87.4z'/%3E%3Cpath class='st0' d='M216.2 59.3c0 10.4 8.1 18.8 18 18.8c9.9 0 18-8.4 18-18.8c0-10.4-8.1-18.8-18-18.8C224.3 40.5 216.2 49 216.2 59.3'/%3E%3Cpath class='st0' d='M324.9 59.8h-3.7l-45.4 47.4l3.1 4.7h19.8v86.9c0 0 0 5.8 0 6.9c0 13.1 0.5 23.5 7.1 30.1c4.8 4.8 12.3 7.1 23.7 7.1c15.7 0 32.1-3.5 49.9-10.6l1.7-0.7l-2.2-9.2l-2.1 0.6c-5.3 1.5-11.3 2.2-17.8 2.2c-32.1 0-32.1-17.1-32.1-45.4v-68h49.1v-18H327V59.8H324.9z'/%3E%3Cpath class='st0' d='M433.7 87.4l-38.4 14.9v5.8l0.8 0.6c14.4 10.9 14.4 14.4 14.4 27.3v63.3c-0.3 25.2-0.9 27.6-20.9 31l-1.8 0.3v8.8h82v-8.9l-1.9-0.2c-29.2-3.5-29.2-5.6-29.2-31v-33.1l0-1.1c-0.3-17.4 2.2-46.8 22.4-48.8c5.2-0.5 11.7 4.9 16.5 8.8l3 2.4l1.2-0.6c8.4-4.2 17.3-13.1 17.3-22.5c0-10-7.6-17.2-18-17.2c-18.4 0-33.8 17.8-42.1 33.3c0.3-10.5 1-31.3 1-31.3l-5.6-2.1L433.7 87.4z'/%3E%3Cpath class='st0' d='M534.9 163.4c0-31.2 14.1-64.7 45.2-64.7c33.3 0 45.8 42.3 45.8 68.9c0 24.6-11.8 63.7-43.3 63.7C549.7 231.4 534.9 191.6 534.9 163.4 M501.7 165.7c0 45.4 32.3 77.1 78.6 77.1c44.1 0 78.7-34.4 78.7-78.4c0-45.4-32.2-77.1-78.3-77.1C535.7 87.3 501.7 121 501.7 165.7'/%3E%3Cpath class='st0' d='M710.6 0.3l-37.1 15V21l0.9 0.6c14.4 10.9 14.4 14.4 14.4 27.3v150.4c-0.3 25.2-1 27.6-22.5 31l-1.8 0.3v8.9h76.7v-8.9l-1.8-0.3c-21.6-3.4-22.5-4.5-22.5-31V2.1L711.4 0L710.6 0.3z'/%3E%3Cpath class='st0' d='M793.9 87.4L753 102.3v6l1 0.6c18 11 18 14.4 18 27.3v63.2c-0.3 25.2-1 27.6-22.5 31l-1.8 0.3v8.9h76.7v-8.9l-1.8-0.3c-21.6-3.4-22.5-4.5-22.5-31V89.3l-5.5-2.1L793.9 87.4z'/%3E%3Cpath class='st0' d='M766.7 59.3c0 10.4 8.1 18.8 18 18.8c9.9 0 18-8.4 18-18.8c0-10.4-8.1-18.8-18-18.8C774.7 40.5 766.7 49 766.7 59.3'/%3E%3Cpath class='st0' d='M868.3 36.2c-10.5 17.6-12.3 36.1-12.7 53.6c-1.8 1.1-25.3 15.4-25.3 15.4v6.6h25.2v87.6c-0.3 25.2-1 27.6-23.1 31l-1.8 0.3v8.9h82.9v-8.9l-1.9-0.2c-28-3.5-28-5.6-28-31v-87.6h40.4v-18h-40.4V76.3c0-23.1 3.2-61.7 24.9-61.7c14.2 0 27.4 17.4 32.5 24.9l0.6 0.9l1.1 0c6.2 0.2 11.5-1.5 15-4.8c2.9-2.8 4.4-6.5 4.4-11.1c0-17.8-23.4-24.4-38.2-24.4C902.7 0.2 881.9 13.7 868.3 36.2'/%3E%3Cpath class='st0' d='M987.7 98.7c14.1 0 22.2 14 25.3 28c-4.5 0.2-49.3 2.2-54.3 2.4C962.4 114.5 971.9 98.7 987.7 98.7 M925.2 168c0 42.7 29 74.8 67.4 74.8c23.1 0 45.7-15 59.1-39.1l0.9-1.6l-7.9-6.1l-1.3 1.8c-9.7 13.6-20.5 19.7-35 19.7c-14.5 0-27.2-5.5-36.9-16c-10.2-11-15.9-26.2-15.9-42.5c0-1.7 0.1-3.4 0.2-5.1c0 0 0.9-11.4 1.1-14.4h90.5l-0.1-2.2c-1.3-30.5-20.9-50.2-50-50.2C956.2 87.3 925.2 122 925.2 168'/%3E%3Cpath class='st0' d='M1436.4 173.1c0.6-90.8 69.3-98.9 63.2-133.3c-7.7-43.9-149-57.6-253.8-9.8c-36 16.4-67.6 33.7-98.5 57.3c-7.3 5.8-9.5 12.6-10 19.2c0.5 38.6 11.9 74.6 31.1 105.1c6-8.3 12.5-17 18.6-25.1c19.6-25.8 23.2-31.2 57.9-58.8c69.5-55.2 178.1-83.1 186.1-59.1c7.9 23.8-37.2 42.7-37.2 107.2c0 43.2 21.1 73.5 39.6 91.8v0c11 9.9 14.9 6.4 22.3 2.1c0.5-0.3 1-0.5 1.4-0.6c13-9.2 24.9-20 35.4-31.9C1459.4 223.9 1436.2 205 1436.4 173.1'/%3E%3C/g%3E%3Cg%3E%3Cpolygon points='950.2 360.9 937.6 329.4 930.1 329.4 947.5 370.8 952.7 370.8 970.1 329.4 962.7 329.4 '/%3E%3Crect x='980.2' y='329.4' width='6.6' height='41.5'/%3E%3Cpolygon points='994.8 335.2 1006.1 335.2 1006.1 370.8 1012.7 370.8 1012.7 335.2 1024 335.2 1024 329.4 994.8 329.4 '/%3E%3Cpath d='M1056.4 351.5c1.5-1.1 2.6-2.5 3.4-4.2c0.8-1.7 1.2-3.6 1.2-5.7c0-2.5-0.6-4.7-1.7-6.6c-1.1-1.8-2.7-3.2-4.8-4.2c-2-1-4.5-1.5-7.2-1.5h-12.9v41.5h6.6v-16.3h2.9l12.4 16.3h8.3l-13.6-17C1053.1 353.4 1054.9 352.6 1056.4 351.5z M1045.4 349h-4.4v-14.4h4.4c2.8 0 4.9 0.6 6.5 1.9c1.5 1.3 2.3 3 2.3 5.3c0 1.5-0.4 2.8-1.1 3.9c-0.7 1.1-1.7 1.9-3 2.5C1048.8 348.7 1047.2 349 1045.4 349z'/%3E%3Cpath d='M1107 334.9c-1.9-2-4.1-3.5-6.7-4.6c-2.5-1.1-5.2-1.7-8.1-1.7c-2.9 0-5.6 0.6-8.1 1.7c-2.5 1.1-4.7 2.6-6.7 4.6c-1.9 2-3.4 4.3-4.5 6.9c-1.1 2.6-1.6 5.4-1.6 8.4c0 3 0.5 5.8 1.6 8.4c1.1 2.6 2.6 4.9 4.5 6.9c1.9 2 4.1 3.5 6.7 4.6c2.5 1.1 5.2 1.7 8.1 1.7c2.9 0 5.6-0.6 8.1-1.7c2.5-1.1 4.8-2.6 6.7-4.6c1.9-2 3.4-4.3 4.5-6.9c1.1-2.6 1.6-5.4 1.6-8.4c0-3-0.5-5.8-1.6-8.4C1110.4 339.1 1108.9 336.9 1107 334.9z M1105 356.2c-0.7 1.9-1.7 3.5-2.9 4.8c-1.2 1.4-2.7 2.4-4.4 3.2c-1.7 0.8-3.5 1.1-5.5 1.1c-2 0-3.8-0.4-5.5-1.1s-3.1-1.8-4.4-3.2c-1.2-1.4-2.2-3-2.9-4.8c-0.7-1.9-1-3.9-1-6c0-2.2 0.3-4.2 1-6c0.7-1.8 1.7-3.4 2.9-4.8s2.7-2.4 4.4-3.2c1.7-0.8 3.5-1.1 5.5-1.1c2 0 3.8 0.4 5.5 1.1c1.7 0.8 3.2 1.8 4.4 3.2c1.2 1.4 2.2 3 2.9 4.8c0.7 1.8 1 3.9 1 6C1106 352.3 1105.6 354.3 1105 356.2z'/%3E%3Cpolygon points='1131.7 329.4 1125.1 329.4 1125.1 370.8 1147.5 370.8 1147.5 365.1 1131.7 365.1 '/%3E%3Crect x='1158' y='329.4' width='6.6' height='41.5'/%3E%3Cpolygon points='1179.4 370.8 1186 370.8 1186 353 1200.8 353 1200.8 347.2 1186 347.2 1186 335.2 1201.9 335.2 1201.9 329.4 1179.4 329.4 '/%3E%3Cpolygon points='1213.6 370.8 1235.9 370.8 1235.9 365.1 1220.2 365.1 1220.2 353 1235.3 353 1235.3 347.2 1220.2 347.2 1220.2 335.2 1235.9 335.2 1235.9 329.4 1213.6 329.4 '/%3E%3Cpath d='M1282.6 354.2h12.5v0.9c0 1.6-0.3 3-1 4.3c-0.7 1.3-1.6 2.4-2.7 3.3c-1.1 0.9-2.4 1.7-3.9 2.2c-1.4 0.5-2.9 0.8-4.5 0.8c-1.9 0-3.7-0.4-5.3-1.2c-1.6-0.8-3.1-1.9-4.3-3.3c-1.2-1.4-2.2-3.1-2.9-5c-0.7-1.9-1-4-1-6.3c0-2.1 0.3-4.1 0.9-6c0.6-1.9 1.5-3.5 2.7-4.9c1.2-1.4 2.6-2.5 4.3-3.3c1.7-0.8 3.7-1.2 5.9-1.2c2.3 0 4.5 0.4 6.7 1.3c2.2 0.9 4 2 5.5 3.6l3.2-5.1c-1.3-1.2-2.8-2.2-4.5-3.1c-1.7-0.8-3.4-1.5-5.3-1.9c-1.9-0.4-3.8-0.7-5.7-0.7c-3.2 0-6.1 0.6-8.7 1.7c-2.6 1.2-4.8 2.7-6.6 4.7c-1.8 2-3.2 4.3-4.2 6.9c-1 2.6-1.4 5.3-1.4 8.2c0 3.1 0.5 5.9 1.6 8.5c1 2.6 2.5 4.9 4.3 6.9c1.9 2 4 3.5 6.5 4.6c2.5 1.1 5.1 1.6 8 1.6c2.4 0 4.7-0.4 7-1.2c2.3-0.8 4.3-1.9 6.1-3.4c1.8-1.5 3.3-3.3 4.3-5.5c1.1-2.1 1.6-4.5 1.6-7.2V349h-19.2V354.2z'/%3E%3Cpath d='M1335.6 351.5c1.5-1.1 2.6-2.5 3.4-4.2c0.8-1.7 1.2-3.6 1.2-5.7c0-2.5-0.6-4.7-1.7-6.6c-1.1-1.8-2.7-3.2-4.8-4.2c-2-1-4.5-1.5-7.2-1.5h-12.9v41.5h6.6v-16.3h2.9l12.4 16.3h8.3l-13.6-17C1332.3 353.4 1334.1 352.6 1335.6 351.5z M1324.6 349h-4.4v-14.4h4.4c2.8 0 4.9 0.6 6.5 1.9c1.5 1.3 2.3 3 2.3 5.3c0 1.5-0.4 2.8-1.1 3.9c-0.7 1.1-1.7 1.9-3 2.5C1328 348.7 1326.4 349 1324.6 349z'/%3E%3Cpath d='M1386.2 334.9c-1.9-2-4.1-3.5-6.7-4.6c-2.5-1.1-5.2-1.7-8.1-1.7c-2.9 0-5.6 0.6-8.1 1.7c-2.5 1.1-4.7 2.6-6.7 4.6c-1.9 2-3.4 4.3-4.5 6.9c-1.1 2.6-1.6 5.4-1.6 8.4c0 3 0.5 5.8 1.6 8.4c1.1 2.6 2.6 4.9 4.5 6.9c1.9 2 4.1 3.5 6.7 4.6c2.5 1.1 5.2 1.7 8.1 1.7c2.9 0 5.6-0.6 8.1-1.7c2.5-1.1 4.8-2.6 6.7-4.6c1.9-2 3.4-4.3 4.5-6.9c1.1-2.6 1.6-5.4 1.6-8.4c0-3-0.5-5.8-1.6-8.4C1389.6 339.1 1388.1 336.9 1386.2 334.9z M1384.2 356.2c-0.7 1.9-1.7 3.5-2.9 4.8c-1.2 1.4-2.7 2.4-4.4 3.2s-3.5 1.1-5.5 1.1c-2 0-3.8-0.4-5.5-1.1s-3.1-1.8-4.4-3.2c-1.2-1.4-2.2-3-2.9-4.8c-0.7-1.9-1-3.9-1-6c0-2.2 0.3-4.2 1-6c0.7-1.8 1.7-3.4 2.9-4.8c1.2-1.4 2.7-2.4 4.4-3.2c1.7-0.8 3.5-1.1 5.5-1.1c2 0 3.8 0.4 5.5 1.1c1.7 0.8 3.2 1.8 4.4 3.2c1.2 1.4 2.2 3 2.9 4.8c0.7 1.8 1 3.9 1 6C1385.2 352.3 1384.9 354.3 1384.2 356.2z'/%3E%3Cpath d='M1427.6 354.3c0 3.8-0.7 6.6-2.1 8.3c-1.4 1.7-3.6 2.6-6.6 2.6c-3 0-5.2-0.9-6.6-2.6c-1.4-1.7-2.1-4.5-2.1-8.3v-24.9h-6.6v26.7c0 5.1 1.3 9 3.9 11.6c2.6 2.6 6.4 3.9 11.4 3.9c5.1 0 8.9-1.3 11.4-3.9c2.6-2.6 3.8-6.5 3.8-11.6v-26.7h-6.6V354.3z'/%3E%3Cpath d='M1468.5 330.8c-2.1-0.9-4.4-1.4-7.1-1.4h-12.9v41.5h6.6v-16.5h6.3c2.7 0 5.1-0.5 7.1-1.5c2.1-1 3.7-2.5 4.8-4.4c1.2-1.9 1.7-4.2 1.7-6.8c0-2.7-0.6-4.9-1.7-6.7C1472.1 333.1 1470.5 331.7 1468.5 330.8z M1467 345.8c-0.8 1.1-1.8 1.9-3.1 2.4c-1.3 0.5-2.8 0.8-4.5 0.8h-4.4v-14.4h4.4c1.7 0 3.1 0.3 4.5 0.8c1.3 0.5 2.4 1.3 3.1 2.4c0.8 1.1 1.2 2.4 1.2 4C1468.2 343.4 1467.8 344.8 1467 345.8z'/%3E%3Cpolygon points='1492.3 329.4 1490.8 329.4 1489 334.3 1487.1 329.4 1485.7 329.4 1484.9 336.9 1486.3 336.9 1486.8 331.8 1488.6 336.7 1489.4 336.7 1491.2 331.8 1491.7 336.9 1493 336.9 '/%3E%3Cpolygon points='1479.5 330.6 1481.4 330.6 1481.4 336.9 1482.8 336.9 1482.8 330.6 1484.7 330.6 1484.7 329.4 1479.5 329.4 '/%3E%3Cpath d='M664.5 370.9v-41.6h10.8c2.7 0 5.1 0.5 7.1 1.4c2 0.9 3.5 2.3 4.6 4c1.1 1.7 1.6 3.8 1.6 6.3c0 2.4-0.5 4.6-1.6 6.4c-1.1 1.8-2.6 3.3-4.6 4.3c-2 1-4.3 1.5-7.1 1.5h-7v17.6H664.5z M668.3 350.1h6c2.1 0 3.9-0.4 5.4-1.1c1.5-0.7 2.7-1.8 3.6-3.1c0.8-1.3 1.3-2.9 1.3-4.7c0-1.8-0.4-3.4-1.3-4.7c-0.8-1.3-2-2.3-3.6-3c-1.5-0.7-3.3-1-5.4-1h-6V350.1z'/%3E%3Cpath d='M694.4 370.9l16.4-41.6h3.6l16.3 41.6h-4.1l-5.1-13.2h-17.9l-5.1 13.2H694.4z M705 354.3h15.3l-7.6-19.9L705 354.3z'/%3E%3Cpath d='M743 370.9v-41.6h10.8c2.7 0 5.1 0.5 7.1 1.4c2 0.9 3.5 2.3 4.6 4c1.1 1.8 1.6 3.9 1.6 6.3c0 2.2-0.5 4.2-1.4 5.9c-0.9 1.7-2.2 3.1-3.9 4.1c-1.7 1-3.7 1.7-6 1.9l13.8 17.9h-4.9l-13.2-17.5h-4.7v17.5H743z M746.8 350.1h6c2.1 0 3.9-0.4 5.5-1.1c1.5-0.7 2.7-1.8 3.5-3.1c0.8-1.3 1.2-2.9 1.2-4.7c0-2.7-0.9-4.9-2.7-6.4c-1.8-1.5-4.3-2.3-7.5-2.3h-6V350.1z'/%3E%3Cpath d='M787.7 370.9v-38.1H775v-3.5h29.2v3.5h-12.7v38.1H787.7z'/%3E%3Cpath d='M850.7 371.7c-2.9 0-5.6-0.6-8.2-1.7c-2.5-1.1-4.8-2.6-6.7-4.6c-1.9-2-3.4-4.3-4.5-6.9c-1.1-2.6-1.6-5.4-1.6-8.4c0-3 0.5-5.8 1.6-8.4c1.1-2.6 2.6-4.9 4.5-6.9c1.9-2 4.1-3.5 6.7-4.6c2.5-1.1 5.3-1.7 8.2-1.7c2.9 0 5.6 0.6 8.2 1.7c2.5 1.1 4.8 2.6 6.7 4.6c1.9 2 3.4 4.3 4.5 6.9c1.1 2.6 1.6 5.4 1.6 8.4c0 3-0.5 5.8-1.6 8.4c-1.1 2.6-2.6 4.9-4.5 6.9c-1.9 2-4.1 3.5-6.7 4.6C856.3 371.2 853.6 371.7 850.7 371.7z M850.7 368c2.4 0 4.6-0.5 6.6-1.4c2-0.9 3.8-2.2 5.4-3.8c1.5-1.6 2.7-3.5 3.6-5.7c0.9-2.2 1.3-4.5 1.3-7s-0.4-4.8-1.3-7c-0.9-2.2-2.1-4.1-3.6-5.7c-1.5-1.6-3.3-2.9-5.4-3.8c-2-0.9-4.2-1.4-6.6-1.4s-4.6 0.5-6.6 1.4c-2 0.9-3.8 2.2-5.4 3.8c-1.5 1.6-2.7 3.5-3.6 5.7c-0.9 2.2-1.3 4.5-1.3 7s0.4 4.8 1.3 7c0.9 2.2 2.1 4.1 3.6 5.7c1.5 1.6 3.3 2.9 5.4 3.8C846.1 367.6 848.3 368 850.7 368z'/%3E%3Cpolygon points='906.4 332.7 906.4 329.4 885.4 329.4 885.4 370.9 889.2 370.9 889.2 351.8 905.3 351.8 905.3 348.4 889.2 348.4 889.2 332.7 '/%3E%3C/g%3E%3C/svg%3E)
No one can argue against the value of high-quality, correctly designed, appropriately powered, multicentre prospective RCTs (or even better systematic reviews of a number of such studies) as the ideal mechanism to generate evidenced-based medicine. But I’m afraid the assisted conception world is far from ideal in this respect and high-quality studies are notoriously difficult to carry out. Unfortunately, some might consider this the situation with evidence in support of the EmbryoScope and morphokinetic embryo selection algorithms, although I’m not sure I’d entirely agree.
We’re often reminded that the UK was the first country in the world to introduce regulation in our field (The Human Fertilisation & Embryology Act (1990)). The HF & E Act required there to be a body to ensure centres were complying with the law (amongst other things) and so along came the Human Fertilisation & Embryology Authority (HFEA). The Act also requires the HFEA to gather and hold information about licensed activities and the HFEA now collects information on over 70,000 treatment cycles each year. It is more often than not, the embryology teams that spend a very significant amount of their time providing the HFEA (albeit electronically) with detailed, validated information about every egg recovered and every embryo generated. The data that can be generated, through the HFEA’s ‘Choose a Fertility Clinic’ (CaFC) section of their website, allows interested parties (like me) to compare clinic performance of licensed centres across the UK. But before going further, I must say that I would be the first to acknowledge the enormous variability that plagues this type of analysis and I certainly agree that ‘league tables’ in our field are often unhelpful, particularly to patients.
Comparing outcomes between centres
Nevertheless, let’s think about the best parameter to examine if we wanted to compare outcomes between centres. Of course, perhaps the biggest factor to try to control for is female patient age – a centre that treats older patients will inevitably have a lower pregnancy rate (unless perhaps they are doing a lot of PGT-A …. but that’s another story) – so helpfully, CaFC allows different age groups to be selected. In my analysis below I have only looked at patients who are less than 35 years old. CaFC also allows you to choose different treatment types so I have only included patients who had IVF or ICSI using the patient’s own eggs. No donor egg treatments were included, and frozen embryos were also excluded from the analysis. CaFC also allows outcome data to be examined on a ‘per embryo transferred’ basis, or in other words the implantation rate (IR). IR essentially reflects the overall quality of embryos being transferred and the centre’s ability to select the ‘best’ embryo(s) to transfer. IR is also a useful outcome measure as it obviates the need to take into account the centre’s approach to single embryo transfer. So IR is probably quite a good marker for the overall ‘quality’ of a laboratory accepting all the many variables that can affect this.
Unfortunately, due to the significant task of gathering, collating and publishing data for CaFC, and of course, the added time required to include ‘live-birth’ information, the CaFC data are always a couple of years out of date. Nevertheless, CaFC provides a useful and well-used resource for patients trying to decide where to go for treatment.
In the period July 2015 – June 2016, IR data are available for 76 UK centres from CaFC. I have, of course, anonymised these data. For the avoidance of confusion, I must also point out that the centre ‘numbers’ in Fig 1 are chosen simply as being ranked from highest (centre number 1) to lowest (centre number 76) IR and are not the formal centre numbers allocated by the HFEA.
Fig 1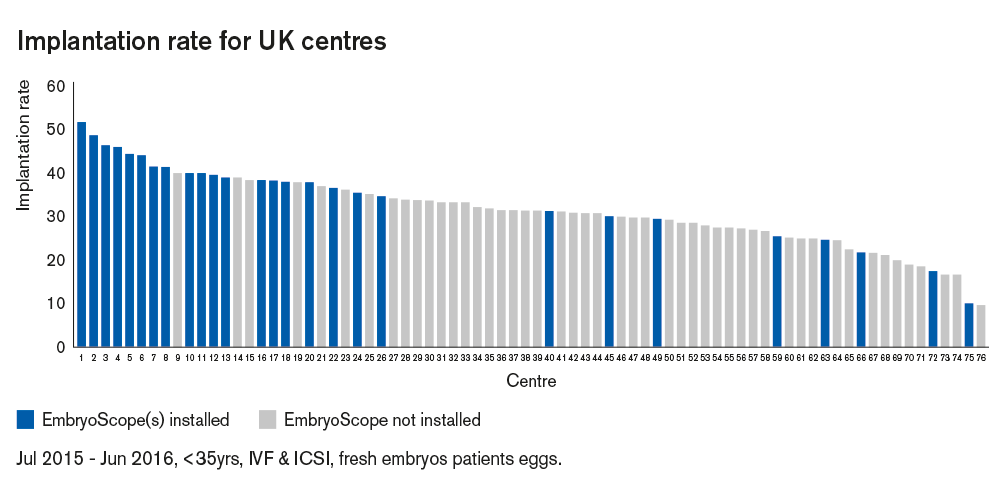 Looking at Fig 1, two things jump out. Firstly, it seems that in the UK, over this twelve-month period, there was a considerable range of IR across centres (from just under 10% to just over 50%). The reasons for these differences between centres are clearly complex and multifactorial and it is impossible to elucidate this further using the data available. Secondly, and perhaps most strikingly, it seems that centres who had at least one EmbryoScope installed and operational over this twelve-month period are very much clustered towards the higher IR end of the graph. I have made the (not unreasonable) assumption that at least some patients will have chosen to use the EmbryoScope in centres where these were installed. Unfortunately, the HFEA do not require information about ‘incubator system’ to be submitted to them and as such I do not know how many ‘EmbryoScope’ cycles within each centre took place. I am aware that at this time in the UK some centres included EmbryoScope use as routine for all patients, whereas in other centres the proportion of patients using the EmbryoScope is likely to be lower as patients would perhaps be charged additionally for its use.
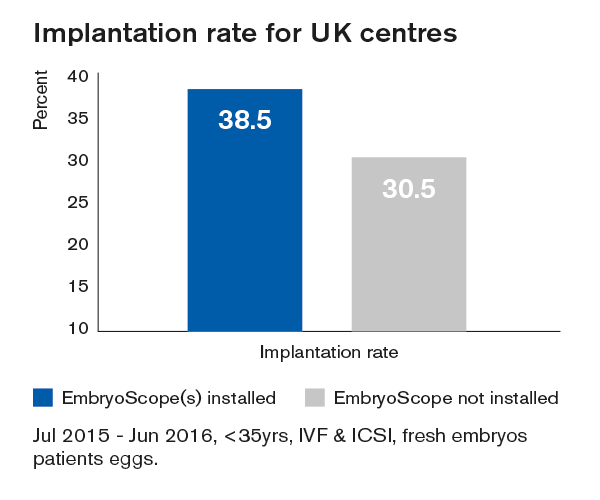
Furthermore, it is also possible to extract the numbers behind the IR calculations and I have calculated the overall IR in centres where at least one EmbryoScope was installed and compared this to centres without an EmbryoScope. This reveals an IR in UK centres with an EmbryoScope as 38.3% (3202/8359) compared to 30.5% (4241/13898) in centres without an EmbryoScope; this is shown in Fig 2. Clearly, due to the nature of these data it is not possible to statistically analyse this difference although it is interesting that the ‘uplift’ of around 8% is similar to that reported in many of the published papers on the subject.
Fig 2
Higher implantation rates in centres with EmbryoScope
So, accepting all the weaknesses and ‘ifs and buts’ of this type of analysis I will end with a simple conclusion. In the UK, in the twelve-month period from July 2015 to June 2016, there appears to have been a clear positive association between centres which had at least one EmbryoScope and those achieving higher IRs. I will leave it up to you to think about whether this might be due to fact that centres with higher IRs are just better centres (maybe they have better clinical care, better air quality, better embryo selection protocols, more skillful embryologists, etc. etc.) but one thing is certainly the case, most of them had an EmbryoScope installed!
Topics: Time-lapse